

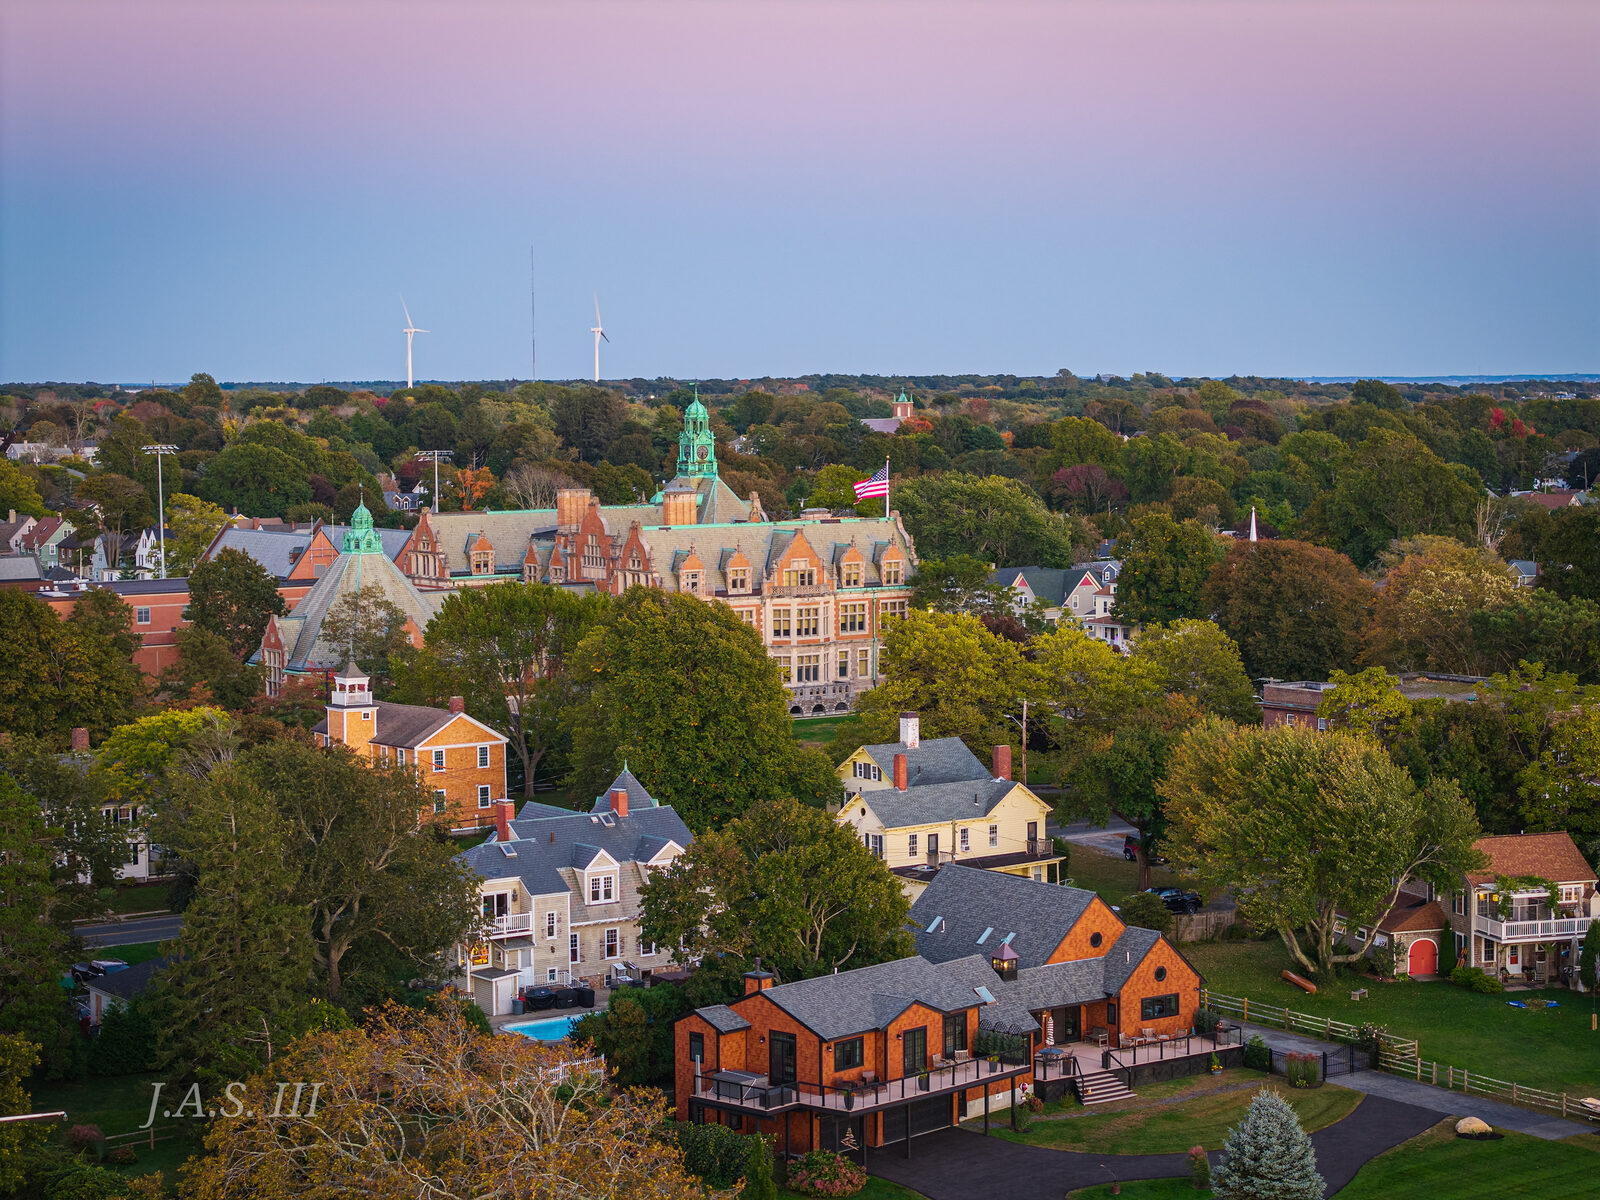
Fairhaven High School from above, Oct. 7, 2026. Photo: John Souza (J.A.S. III)
Fairhaven housing market
Home prices, sales, homes for sale, rents and the public record for Fairhaven, updated every week.
This week's market story, Oct. 19, 2026
More than half of Fairhaven home sales close above asking as sales slip
The median sale price was nearly unchanged at $507,973. Fewer homes sold, but a larger share of them went for more than the asking price.
More than half the homes that sold in Fairhaven this summer went for more than their asking price, even as fewer of them changed hands. Redfin, a national real estate brokerage, found that 52.4% of the town's sales from July to September closed above list price, up from 42.3% in the same months of 2025. The number of sales fell to 43 from 52.
Homes in Fairhaven sold for a median $507,973 in the three months ending Sept. 30, 2026, down 0.9% from the same months a year earlier, according to Redfin. In all, 43 homes sold, and the typical one went under contract in 25 days. Zillow puts the typical home in town at $505,791, up 3.1% from a year earlier.
Sales and prices
Median sale price
$507,973
Down 0.9% from a year earlier
Redfin, three months ending Sept. 30, 2026; Redfin updated it Oct. 7, 2026
Homes sold
43
Down 18.0% from a year earlier
Redfin, three months ending Sept. 30, 2026; Redfin updated it Oct. 7, 2026
Price per square foot
$371
Down 1.5% from a year earlier
Redfin, three months ending Sept. 30, 2026; Redfin updated it Oct. 7, 2026
Sale price to list price
101.3%
Up 2.2 points from a year earlier
52% of homes sold for more than their first asking price.
Redfin, three months ending Sept. 30, 2026; Redfin updated it Oct. 7, 2026
Supply and speed
Homes for sale
81
Down 8.3% from a year earlier
Every home listed at any point in the three months.
Redfin, three months ending Sept. 30, 2026; Redfin updated it Oct. 7, 2026
For sale on the last day
39
Up 40.6% from a year earlier
About 2.8 months of supply at the recent pace of sales.
Redfin, three months ending Sept. 30, 2026; Redfin updated it Oct. 7, 2026
New listings
51
Down 12.9% from a year earlier
Redfin, three months ending Sept. 30, 2026; Redfin updated it Oct. 7, 2026
Days on market
25
2 days faster than a year earlier
Median days from listing to accepted offer.
Redfin, three months ending Sept. 30, 2026; Redfin updated it Oct. 7, 2026
Values, rents and borrowing
Typical home value
$505,791
Up 3.1% from a year earlier
A middle-of-the-market value for every home in town, sold or not.
Zillow Home Value Index, September 2026
Median rent paid
$1,118 a month
Rent and utilities that renters in Fairhaven report paying. Zillow does not track asking rents here; the line shows Bristol County asking rents, now $2,072.
Census Bureau, American Community Survey, 2020 to 2024 average
30-year mortgage rate
7.40%
Up 1.1 percentage points from a year earlier
A national average. On a $507,973 home with 20% down, principal and interest come to about $2,814 a month.
Freddie Mac, week of Oct. 15, 2026
Month by month
Each row is a three-month window, so each month counts in three rows. That smooths out the swings a town this size would show month to month.
| Three months | Median price | Sold | Days on market | Sale to list | For sale | Per sq. ft. |
|---|---|---|---|---|---|---|
| July to September 2026 | $507,973 | 43 | 25 | 101.3% | 81 | $371 |
| June to August 2026 | $498,000 | 55 | 24 | 101.0% | 78 | $340 |
| May to July 2026 | $495,000 | 49 | 23 | 100.5% | 86 | $339 |
| April to June 2026 | $512,500 | 46 | 24 | 99.5% | 85 | $319 |
| March to May 2026 | $514,000 | 29 | 25 | 99.1% | 70 | $324 |
| February to April 2026 | $496,250 | 24 | 32 | 99.6% | 69 | $338 |
| January to March 2026 | $513,000 | 26 | 30 | 99.7% | 50 | $392 |
| December 2025 to February 2026 | $549,999 | 27 | 28 | 99.2% | 51 | $353 |
| November 2025 to January 2026 | $537,500 | 36 | 31 | 98.4% | 57 | $329 |
| October to December 2025 | $500,000 | 35 | 34 | 98.2% | 61 | $328 |
| September to November 2025 | $510,000 | 45 | 35 | 98.7% | 74 | $344 |
| August to October 2025 | $507,500 | 50 | 32 | 98.6% | 81 | $360 |
Source: Redfin, three months ending Sept. 30, 2026; Redfin updated it Oct. 7, 2026. Read Oct. 18, 2026.
Tax bills, fiscal 2018 to 2026
The average single-family tax bill in Fairhaven went from $3,205 in fiscal 2018 to $4,374 in fiscal 2026, up 36%, while the average assessed value rose 75%. When values climb faster than the town's budget, the rate per $1,000 falls. The fiscal 2027 rate is set at the tax classification hearing late this year.
| Fiscal year | Average bill | Change | Average value | Rate per $1,000 |
|---|---|---|---|---|
| 2026 | $4,374 | +3.3% | $475,941 | $9.19 |
| 2025 | $4,234 | +4.5% | $454,253 | $9.32 |
| 2024 | $4,050 | +3.3% | $438,807 | $9.23 |
| 2023 | $3,921 | +4.8% | $394,058 | $9.95 |
| 2022 | $3,743 | +3.7% | $366,206 | |
| 2021 | $3,608 | +3.1% | $319,583 | |
| 2020 | $3,501 | +4.9% | $316,541 | |
| 2019 | $3,339 | +4.2% | $286,122 | |
| 2018 | $3,205 | $272,739 |
Source: Mass. Department of Revenue, Division of Local Services, Municipal Databank, average single-family tax bill and tax rates by class. The rate column shows the years the state's rate report covers. Read Oct. 18, 2026.
Who owns, who rents
The Census Bureau's survey of households, averaged over five years so a small town has enough answers to count. It moves slowly; use it for the shape of a town, not for this year's prices.
| Measure | Fairhaven | Massachusetts |
|---|---|---|
| Homes and apartments | 7,619 | |
| Owned by the people living there | 74% | 63% |
| Median value, owner-occupied homes | $446,700 | $562,100 |
| Median rent paid | $1,118 | $1,762 |
| Renters paying 30% or more of income for housing | 49% | 49% |
| Median household income | $95,965 | $103,960 |
| Median year built | 1952 | 1964 |
Source: U.S. Census Bureau, American Community Survey 5-year estimates, 2020 to 2024, tables B25001, B25003, B25035, B25064, B25070, B25077 and B19013. Read Oct. 18, 2026.
From the public record
| Measure | Fairhaven | Note | Source, read Oct. 18, 2026 |
|---|---|---|---|
| New housing units permitted, January to August 2026 | 10 (10 single-family) | Filed by the town, 5 of 8 months | Census Bureau, Building Permits Survey |
| Average single-family tax bill, fiscal 2026 | $4,374 | On an average value of $475,941; residential rate $9.19 per $1,000; up $140 from fiscal 2025 | Mass. Department of Revenue, Municipal Databank |
| MBTA Communities zoning | Not on the list | The state law requiring multifamily zoning near transit does not apply here | Executive Office of Housing and Livable Communities, status as of Aug. 31, 2026 |
Where these numbers come from
- Redfin Data Center, Housing Market Tracker, city, county and state files (data through September 2026; read Oct. 18, 2026). Data from Redfin, a national real estate brokerage.
- Zillow Research, Zillow Home Value Index (ZHVI) and Zillow Observed Rent Index (ZORI) for cities and counties (data through September 2026; read Oct. 18, 2026).
- Freddie Mac, Primary Mortgage Market Survey, weekly averages (newest week Oct. 15, 2026; read Oct. 18, 2026).
- U.S. Census Bureau, American Community Survey 5-year estimates, 2020 to 2024, summary files (read Oct. 18, 2026).
- Mass. Department of Revenue, Division of Local Services, Municipal Databank, average single-family tax bill and tax rates by class, fiscal 2018 to 2026 (read Oct. 18, 2026).
- Bristol County Fall River District Registry of Deeds, Significant Sales 2026, Q1 (posted April 28, 2026; read Oct. 18, 2026).
We refresh these figures every week. Redfin and Zillow post new months in the middle of each month; Freddie Mac posts rates on Thursdays. See an error? Email corrections@southcoast360.com.